Risk Scores are configurable and have many different options such as relevant risk factors, risk rollup method, risk score thresholds, adjustable risk weights, and more. Settings will allow you to visualize the data in accordance with your organization’s requirements, and also allow you to define you risk appetite.
Below are a few of the settings and configurations that company admins can consider defining on the Risk settings page: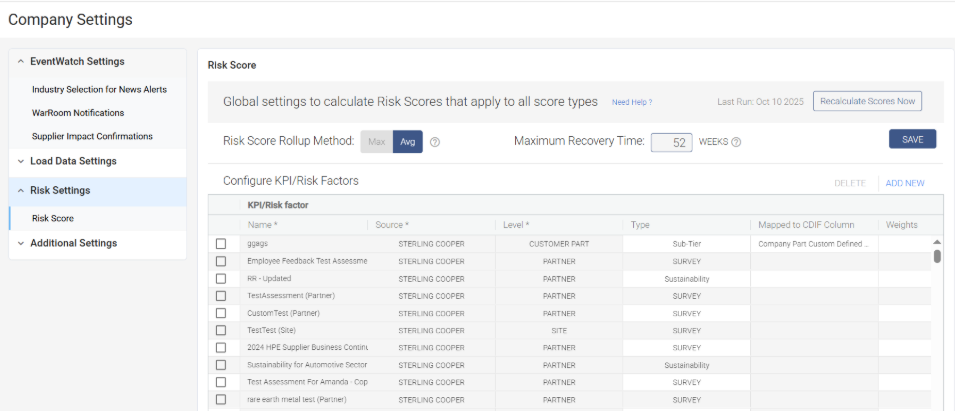
- Define the Risk Score Rollup Method – MAX or AVG.
- The default roll-up method is set to Average, which means the system considers average of all risk scores while calculating risk. While users can see scores which are more evenly spread out, the highest risk score may not be apparent.
- Refer to the illustration of risk score calculation when its set to Avg.

- In the illustration, the site level Natural Disaster score when rolled up at supplier level shows an average of the 2 sites which is “6” however if the MAX setting is used, the score will be changed to “8” which is the highest scores amongst the 2 supplier sites.
- The MAX roll up method highlights the highest risk areas however this may not provide an accurate picture of overall risk.
- The risk score calculation in the system is dynamic. Risk score originating at any level get calculated upwards and downwards at different supply chain levels. E.g., A financial score which originate at supplier level is applied to all the sites for that supplier & the same score then gets further rolled down or applied to the part/s mapped to the supplier site/s. As shown in the illustration above.
2. Define Maximum Recovery Time
Maximum recovery time is set by default to the maximum setting of 52 weeks. The company admin can define the time as per company standards. The maximum recovery time set will be used in the calculation of Recovery time for supplier sites.
Recovery time for the sites can be provided by the customers in the CDIF or it can be collected from the suppliers via a Supply Chain Visibility assessment. For example, if the maximum recovery time is set to 52 weeks and a site recovery time is 20 weeks, the recovery score for that site will be calculated as below,

As mentioned in the example, if the maximum recovery time is reduced, the site recovery score will increase. Setting correct maximum recovery scores will define the company’s acceptable site recovery time.
3. Configure KPI/ Risk factors
Adding risk scores for each element of your supply chain can create a well-rounded and heathy supplier risk score program. Loading risk scores just at supplier & site level or monitoring only 1-2 types of risk factors may not result in a comprehensive risk rating. It is advisable to define key risk parameters as a part of your organization’s SCRM objectives and to monitor different types of risk such as supplier financial scores, site location-based scores, Cyber security, Business continuity planning, compliance etc. An inclusive risk scorecard can allow users to better identify areas of high risk and create more effective mitigation strategies.

Assigning weights to each risk variable based on importance is recommended. The weights assigned to each risk component factor into the system calculated Resiliency risk score which acts as an overall risk indicator for each partner, site, part, product, or category.
With the option to set risk thresholds companies can specify the acceptable risk score range for each risk factor. For example, supplier financial health can be an important area that organizations may want to closely track. By setting up high weights for this factor and lowering the risk score threshold, users can ensure any suppliers outside of the acceptable risk parameters are identified. Setting risk thresholds can not only help in risk identification but also it can act as a benchmark for suppliers or categories within your supply chain. Additionally, these risk thresholds allow users to keep the risk within set targets and even help reduce risk associated with targeted areas.
4. Category Risk Score Roll Up
Categories in the Resilinc portal can be tied to partner and part levels. Customers can visualize the data by assigning categories partners and parts. Depending upon customer use case, Category risk scores can be calculated using partner or part level information.
For example, if customers only have categories assigned to partners but not to parts, they can choose category risk score roll up and the system will take the Average or Max risk score from the group of partners who are assigned to that category and roll it up at the category level. Category risk score can be beneficial for Category leads, managers, or procurement executives in identifying high risk categories and discovering the suppliers who require attention or risk mitigation.
5. Resiliency risk calculation
The resiliency risk score is an overall health indicator assigned to each supply chain element loaded in the portal by the customer. The resiliency score is calculated as a weighted average of all the available risk scores associated to respective elements like partner, site, part, product etc. The resiliency score gives an indication about the risk factors for that element, so if a supplier has a high resiliency score that is an indication that there are risk areas associated with that supplier which need to be analyzed.
This is helpful for customers and risk teams when there are thousands of suppliers being monitored and users see all of the suppliers, sites, or parts categorized by their resiliency score group. Users can then filter the suppliers with high risk to drill into the detailed risk scores or review the suppliers with low risk to ensure availability of all the risk factors and accuracy of the risk scores.

As you can see in figure 28 above, when the risk scores are unavailable, the system ignores the weights assigned to those risk factors and only considers risk scores and weights for available risk score factors, in the final calculation. This approach gives an accurate data driven risk score picture.
Was this article helpful?
That’s Great!
Thank you for your feedback
Sorry! We couldn't be helpful
Thank you for your feedback
Feedback sent
We appreciate your effort and will try to fix the article