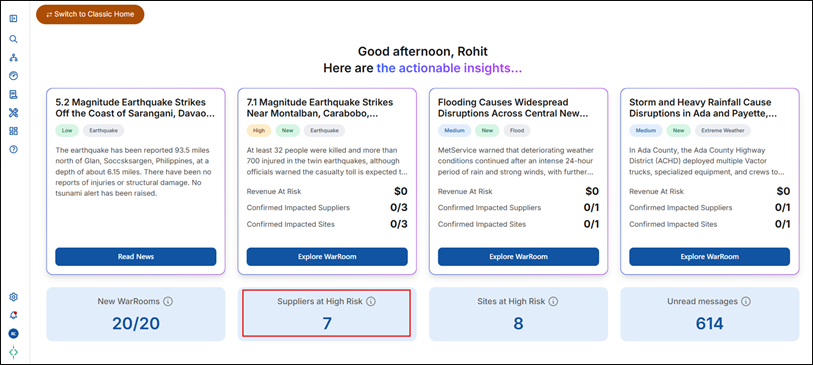
- The Suppliers at High Risk count on the Home page is driven by your organization's configured High Risk Threshold for the Resiliency Risk score. This article explains how the count is calculated and how you can verify it on the Analyze Risk page.
- The Home page displays the Suppliers at High Risk count as an actionable insight. This count is based on your organization's configured High Risk Threshold.
- How the count is determined:
- Risk scores in the platform are measured on a scale of 1 to 10. Any supplier whose Resiliency Risk score is equal to or greater than your organization's configured High Risk Threshold is included in this count.
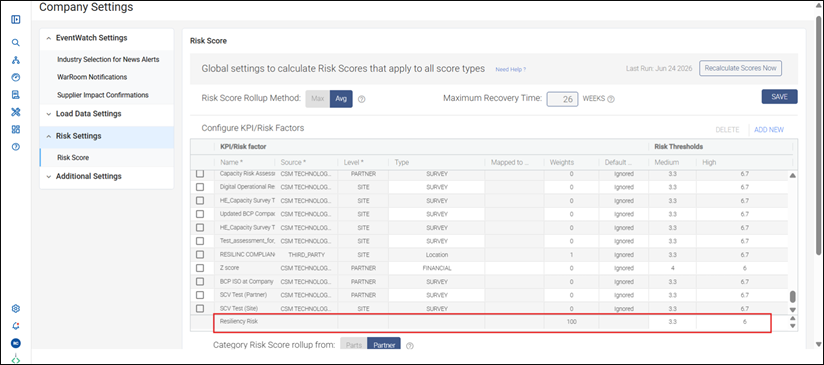
- To check what threshold is configured for your organization, go to Company Settings via the left navigation menu, then navigate to Risk Settings > Risk Score. Under the Configure KPI/Risk Factors table, look at the Risk Thresholds column for the Resiliency Risk factor. The High threshold value shown there is what drives the count on the Home page.
- The Risk Settings page under Company Settings shows your organization's configured High Risk Threshold. The value in the Risk Thresholds column for the High category determines which suppliers are counted as high risk on the Home page.
- How to verify the count on the Analyze Risk page:
- Navigate to the Analyze Risk page by clicking on RiskScore in the left navigation menu, then go to the Supplier tab. There are two ways to cross-check the count:
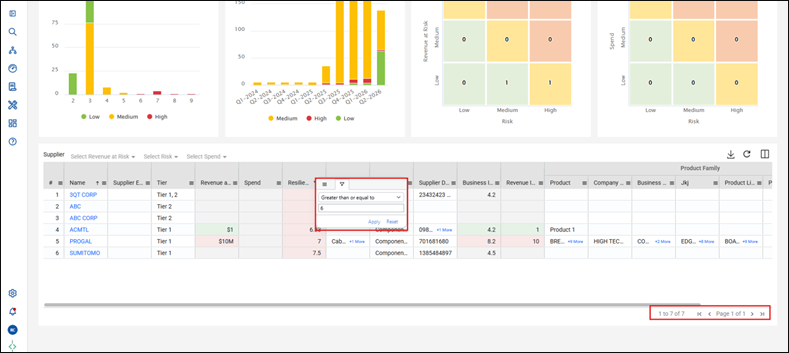
- Using the Risk Distribution Trend chart: In the Risk Distribution Trend chart, select only High from the legend at the bottom of the chart and hover over the relevant time period. The tooltip will show the high-risk supplier count for that period, which should match the Home page count.
- Using the Suppliers grid: In the Suppliers table on the same page, apply a filter on the Resiliency Risk column with the condition "Greater than or equal to" your configured High threshold value. The resulting list will display exactly the suppliers counted as high risk, and the total should match the Home page count.
- On the Analyze Risk page (Supplier tab), hover over the High bar in the Risk Distribution Trend chart to see the count for a specific period, or apply a filter in the Suppliers table on the Resiliency Risk column to get the matching list.
Note: The count on the Home page always reflects the current period. If you are viewing a different time period in the Analyze Risk charts without applying the correct filters, the numbers may appear different. Always use the verification steps above for an accurate comparison.
Was this article helpful?
That’s Great!
Thank you for your feedback
Sorry! We couldn't be helpful
Thank you for your feedback
Feedback sent
We appreciate your effort and will try to fix the article